Inventory × POS × food cost — one system

Know your food cost.
To the dollar.
Every week.

VariCount connects your Toast POS, your vendor invoices, and your physical counts — so every week ends with a signed variance report that shows exactly what went missing, where, and what it cost you.

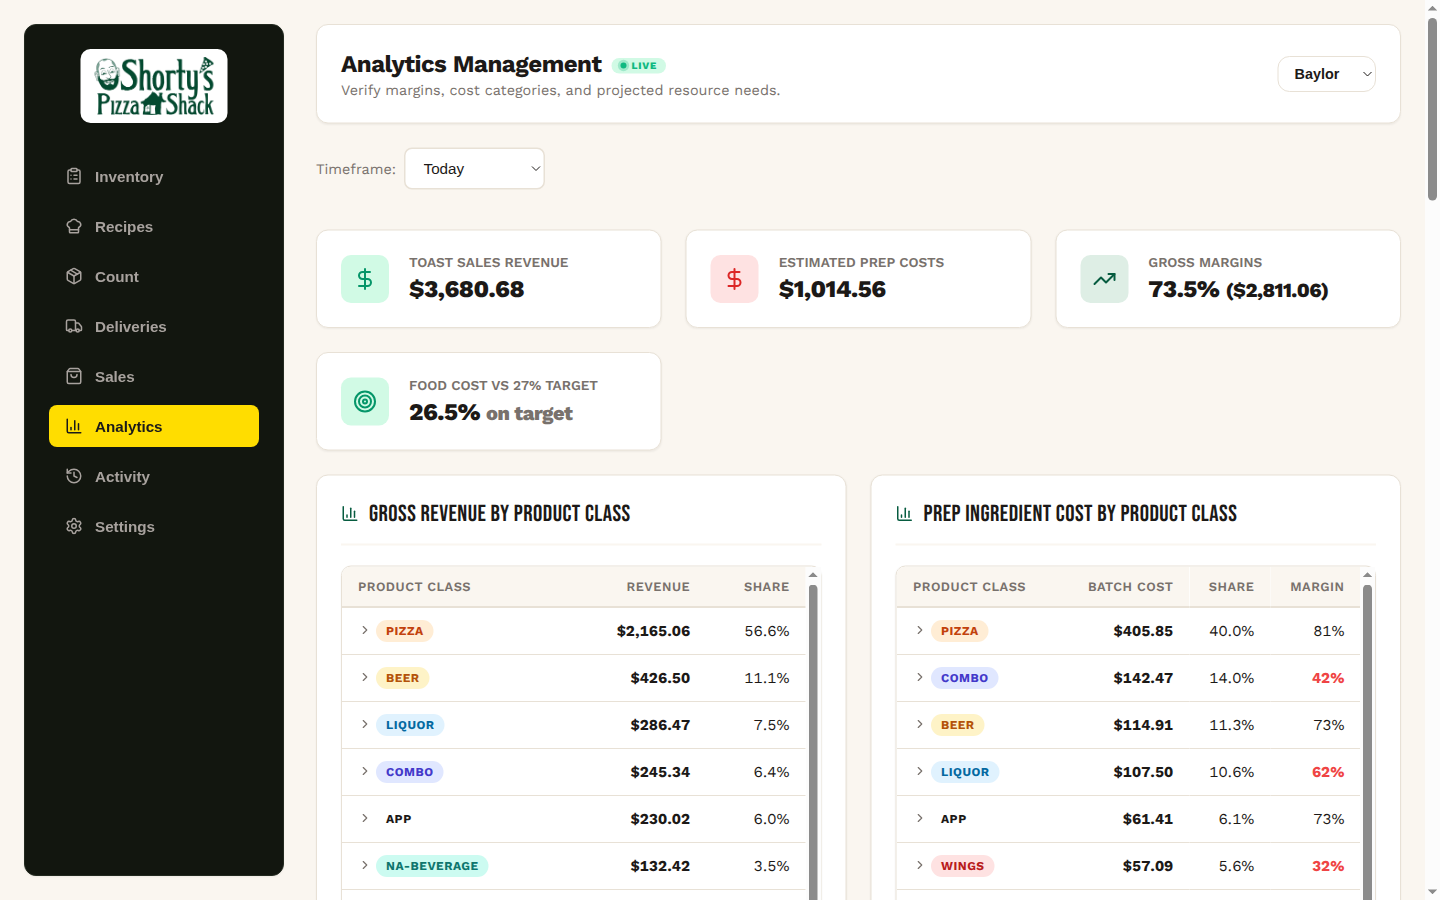
26.5%food cost vs 27% target — a real week
+$6,224net variance caught in one count cycle
15 minsales sync cadence from Toast
app.varicount.com/analytics
Analytics dashboard: Toast sales revenue, estimated prep costs, gross margins, and food cost vs target

Live analytics from a real kitchen — revenue, prep cost, gross margin, and food cost vs. target.

In production

Running every week inside Shorty’s Pizza Shack — multi-location, real counts, real invoices, real numbers.

The gap nobody closes

Your POS knows what you sold. Your invoices know what you bought. Nothing knows what you lost.

🧾

Sold

Toast rings every ticket — but sales data on its own can’t tell you what those tickets should have used up.

🚚

Bought

Invoices pile up in a shoebox or a shared drive — so delivered stock never makes it onto the count sheet.

🕳️

Lost

Over-pours, waste, theft, and bad counts are invisible until the end of the month — if you catch them at all.

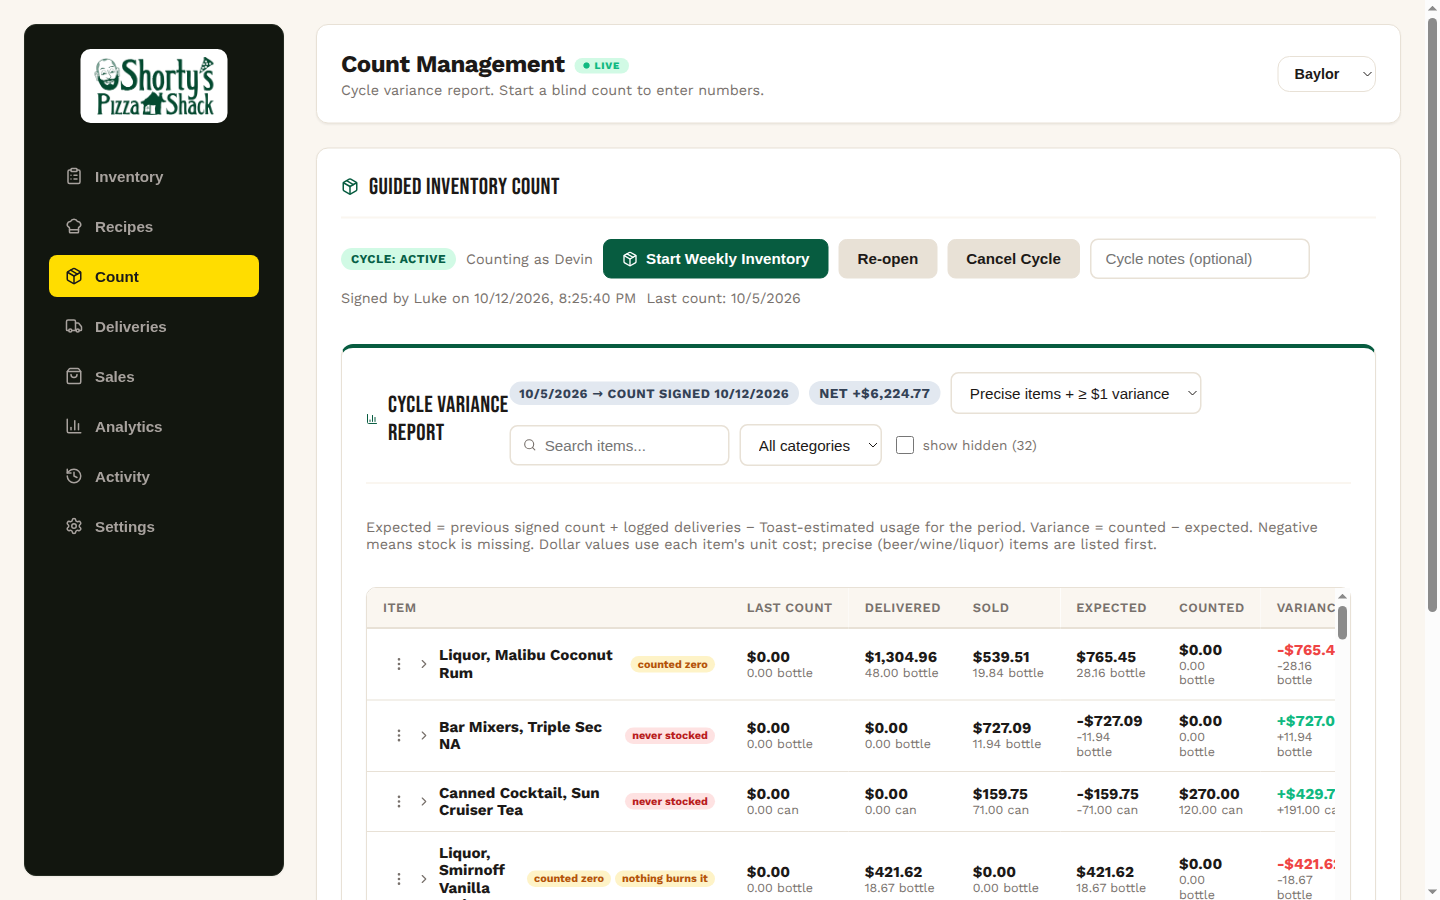
VariCount closes the loop: expected = last count + deliveries − POS-estimated usage. Count against that expectation and every discrepancy surfaces as a dollar amount — not a shrug.

The weekly loop

Four steps. One signed report. Zero spreadsheet archaeology.

01

Sales sync themselves

Toast sales pull in automatically every 15 minutes and map to your recipes — with a catch-up after any downtime.

02

Deliveries land on the ledger

Snap a photo of the invoice — AI reads the lines. Or bulk-import CSV / MarginEdge. Every case priced and dated.

03

Count on your phone

Guided counts by storage area, optional blind-count mode so numbers aren’t anchored to expectations.

04

Sign off, see the truth

One tap closes the cycle: a variance report in dollars, item by item, with an AI second opinion on the big movers.

The product

Built for the walk-in, not the back office

Everything below is the live product — not mockups.

/count
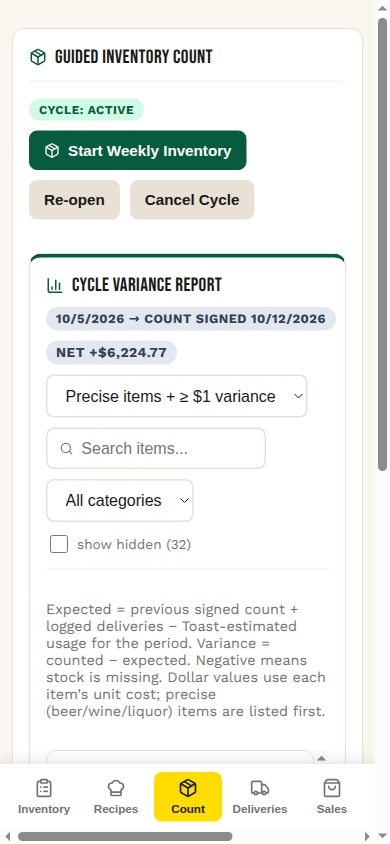
Cycle variance report comparing counted stock against expected

The variance report: counted vs. expected, every line in dollars. Negative means it walked out the door.

/deliveries
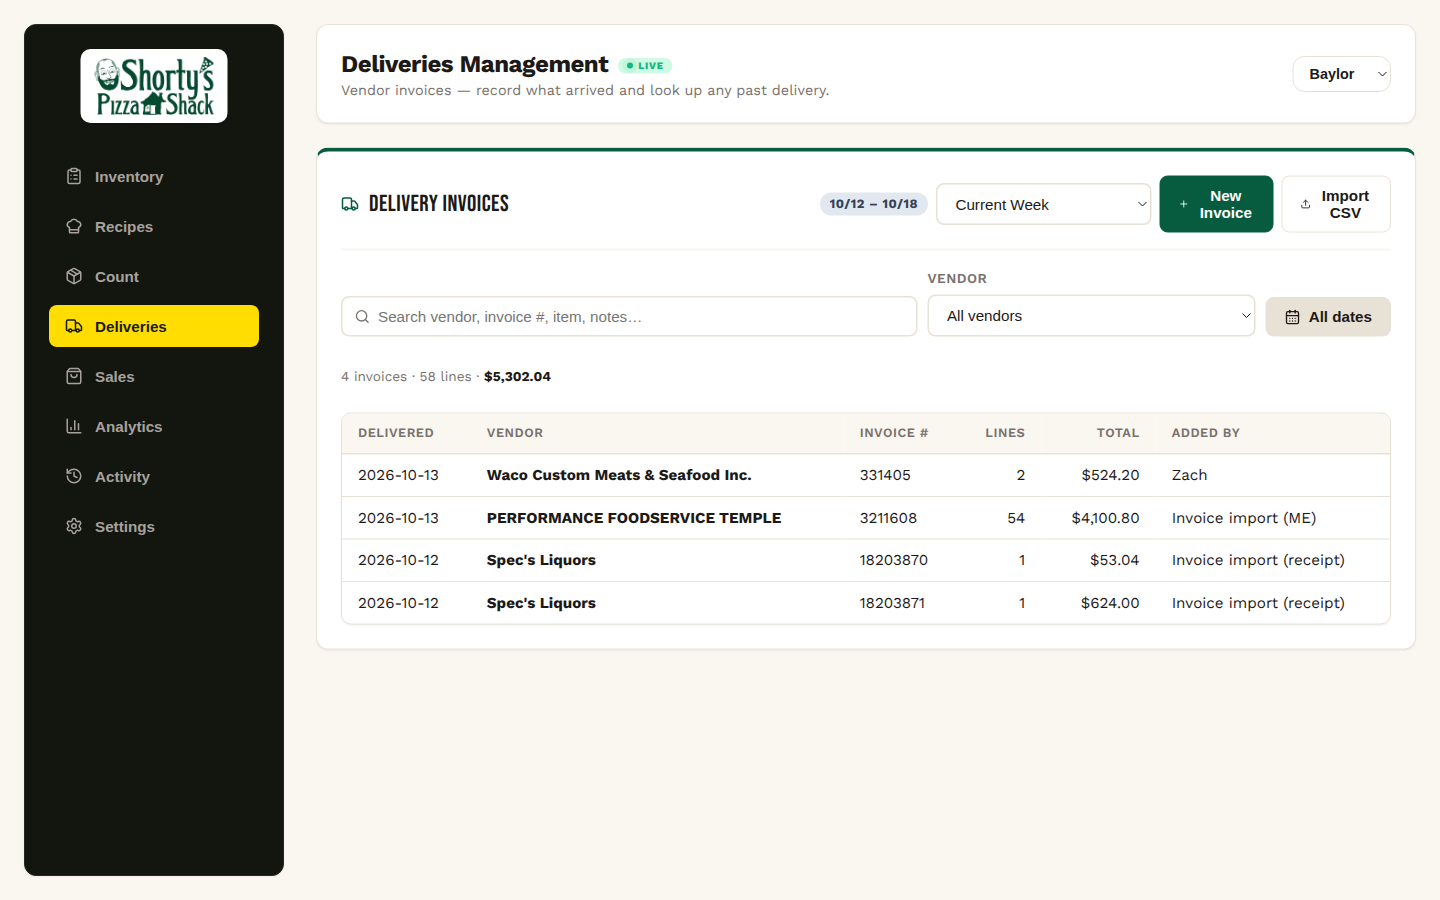
Delivery invoices ledger with vendor, invoice number, lines and totals

The delivery ledger — photo-scan an invoice, import CSV, or pull a MarginEdge count in one click.

/sales
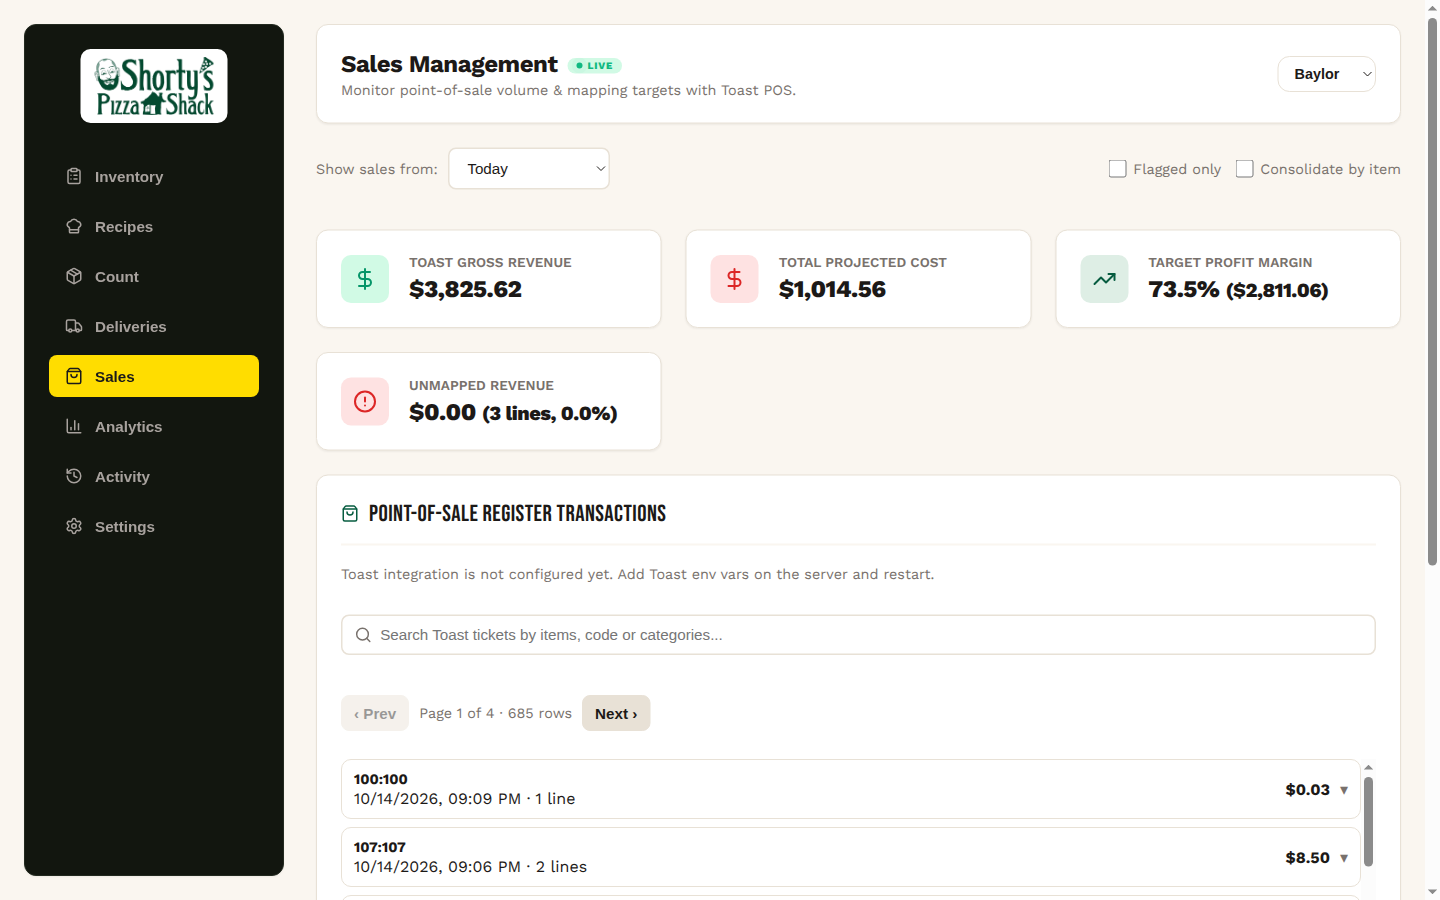
Sales register with Toast gross revenue, projected cost, and unmapped revenue tracking

Toast tickets, mapped to recipes. The unmapped-revenue card shows exactly how much of your POS is covered.

/recipes
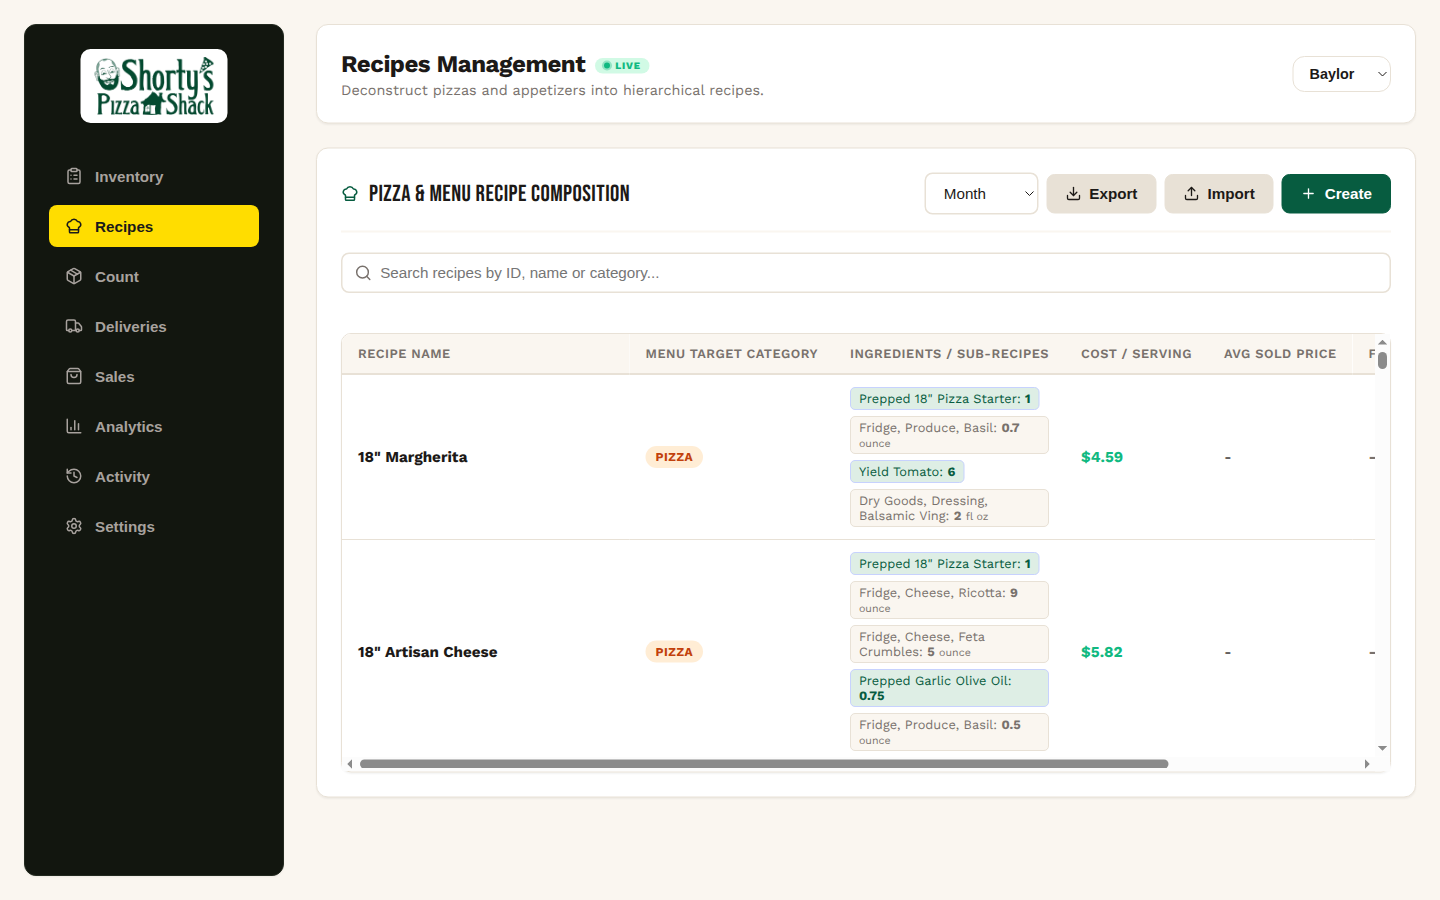
Recipe composition with nested sub-recipes and cost per serving

Nested recipes — a pepperoni pizza is a cheese pizza plus pepperoni. Cost per serving updates as invoice prices move.

Weekly inventory count on a phone

The whole app is phone-first — count in the walk-in, sign off at the pass. Android app included.

What’s inside

Everything between the invoice and the P&L

POS

Toast integration

Scheduled sync every 15 minutes with a boot-time catch-up — sales are recovered after downtime, not silently skipped. Map each menu item to a recipe once; it applies forever.

Counts

Guided weekly counts

Storage-area order, blind-count mode, draft autosave on the device, and a formal sign-off that opens the next cycle.

Variance

Dollar-denominated variance

Counted vs. expected per item — expected math accounts for deliveries and POS usage. AI second opinion flags the lines that matter and why.

Invoices

AI receipt scanning

Photograph a vendor invoice; the vision model extracts vendor, date, lines, and prices into a review screen — then posts to the ledger.

Costing

Nested recipe costing

Recipes built from recipes — dough → pizza starter → Margherita. Unit conversions and latest-invoice pricing keep cost/serving current.

Analytics

Margin & price watch

Food cost vs. target, gross margin by product class, revenue trends, and supplier price creep — by day, week, or month.

Imports

MarginEdge & CSV

Already counting somewhere else? Bulk-import invoices from CSV or pull a historical MarginEdge count list in as a signed-off cycle.

People

Staff, manager & owner roles

PIN login built for shift speed. Managers run one store; owners see them all. Staff see only what they need.

Mobile

Phone-first + Android app

The count sheet fits a phone screen — because counts happen on a ladder in the walk-in, not at a desk.
Multi-location

One brand, many stores. One screen, every dollar.

Recipes and your item catalog live once at the brand level; counts, sales, deliveries, and variance stay per-store. Consolidated rollups are a built-in view, not a month-end project.

Shared catalog, local counts

A dough recipe exists once — both stores’ food-cost reports reference it. Sale mappings learned at store 1 help store 2 on day one.

Owner view, side-by-side

Owner role compares locations line-by-line on sales and analytics — revenue trends and product classes, store against store.

Locked to their store

Per-user store scoping: a manager at one location sees their store’s numbers, not the whole company’s.

Plays well with

Connects to how you already work

Toast POS MarginEdge CSV invoice import AI receipt & invoice scanning Android app PWA — install on any device

Get started

We’ll set you up. You keep counting.

Concierge onboarding: we create your locations, import your items and recipes, connect Toast, and load your last count — so your first signed variance report lands inside a week. Simple per-location pricing.

Book a demo — kennethlukestorey@gmail.com
Do I have to switch POS?

No. VariCount sits on top of Toast — sales pull in automatically. If you run a different POS, talk to us; the sales pipeline is built to add integrations.

We already count in MarginEdge / a spreadsheet.

Import your history and keep going — bulk CSV invoice import and MarginEdge count-list import are built in.

How accurate is “expected” inventory?

Expected = last signed count + logged deliveries − Toast-estimated usage from your recipes. It won’t replace the count — that’s the point. The variance between expected and counted is where the money hides.

Multiple locations?

That’s the design, not an add-on. One brand account, shared recipes, per-store counts and variance, consolidated owner rollups.

What does it cost?

A simple per-location subscription — priced on the number of stores, every feature included. Book a demo and we’ll quote it for your setup.